La dernière loi sur l’accélération des énergies renouvelables vise ainsi à identifier les zones les plus propices aux installations éoliennes et solaires.
Cette cartographie permettra d’exploiter pleinement les énergies disponibles sur chaque territoire.
Si cet exercice d’identification s’est imposé sur les grosses installations, sur les toits les panneaux solaires photovoltaïques constituent la solution de référence, faute d’alternative démocratisée.
Pourtant, de même que dans les champs, les rendements d’un panneau solaire photovoltaïque sur les toits varient selon les conditions d’ensoleillement. Certaines zones sont ainsi plus propices à l’éolien, certaines au solaire et d’autres au deux énergies. Avec l’émergence de technologies hybrides : plus besoin de choisir !

Les solutions de production d'électricité en toiture
Les solutions de production d'électricité en toiture
Les panneaux solaires photovoltaïques
La capacité d’un panneau solaire est définie par sa puissance, exprimée en watts-crête (Wc). Elle correspond à la puissance maximale délivrée par le panneau solaire dans des conditions d’ensoleillement standard (1 000 W/m² à 25°C).
À titre d’illustration, on donne la carte ci-contre qui présente le rapport entre l’énergie produite et la capacité de panneaux solaires photovoltaïques installée.
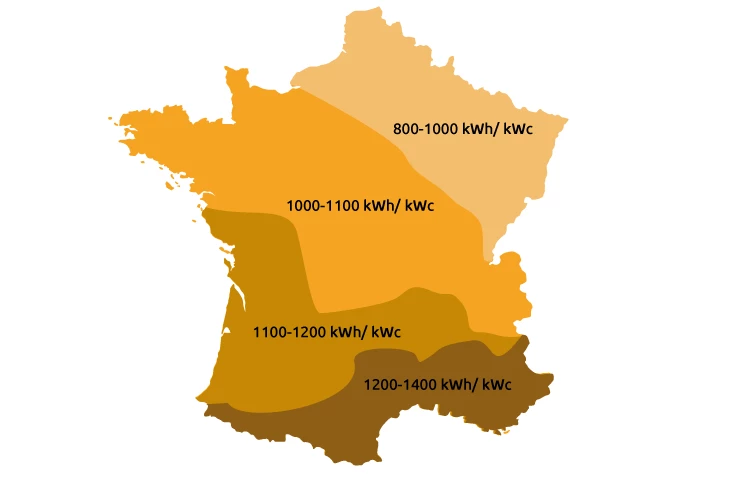
A Lille, il y a entre entre 800 et 1 000 heures de fonctionnement à puissance maximale. À Marseille, entre 1 200 et 1 400 heures de fonctionnement à puissance maximale. Le rendement énergétique d’un watt-crête de panneau solaire photovoltaïque installé sur un toit est donc compris entre 0,8 et 1,4 en moyenne, en France.
Les éoliennes de toiture
Le rendement énergétique se calcule grâce au ratio entre la puissance installée et l’énergie produite annuellement. Le calcul est plus compliqué : le rendement de l’éolienne dépend de la zone, de la hauteur du bâtiment, de son exposition et de son environnement. En exploitant la courbe de puissance ci-contre et la rose des vents d’un lieu donné, on peut calculer l’électricité produite sur un an.
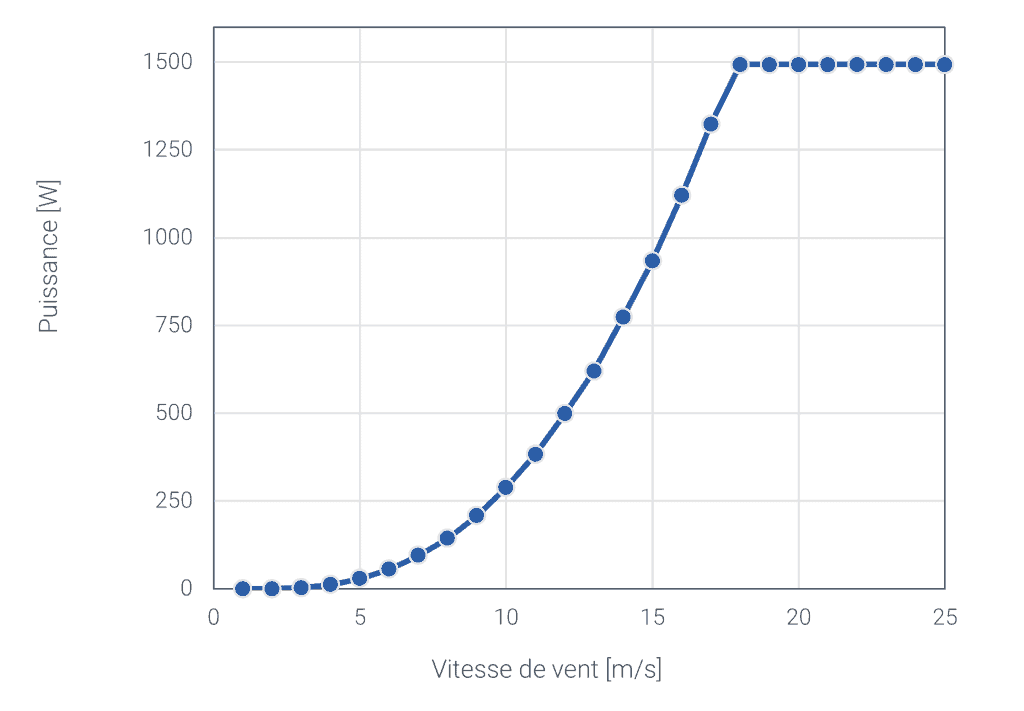
La turbine de la WindBox a une production qui varie de 1 000 kWh à 2 000 kWh par an pour une puissance « crête » de 1 500 W.
Le rendement énergétique d’un watt éolien de WindBox installé sur un toit est donc compris entre 0,67 et 1,3 en moyenne, en France.
Vers un mix électrique en toiture ?
S'affranchir de la saisonnalité des énergies renouvelables
L’énergie solaire est une source d’énergie saisonnière. La production issue de panneaux solaires connaît un pic sur les mois d’été et s’amenuise sur les mois d’hiver, lorsque l’ensoleillement se fait moins fréquent et moins fort. L’énergie éolienne est également saisonnière dans la plupart des zones géographiques. On observe une courbe de production inverse à celle du solaire : la production éolienne connaît un pic en hiver et décroît sur les mois de printemps-été.
En cumulant éolien et solaire, les modules hybrides comme la WindBox permettent de lisser la courbe de production.
Pour illustrer ces propos, prenons l’exemple de deux villes aux caractéristiques différentes (Hambourg et Marseille) et comparons la production solaire, éolienne et hybride sur un bâtiment de la ville. Sur chaque cas test, on considère que les critères d’installation sont respectés.
Cas test 1 :
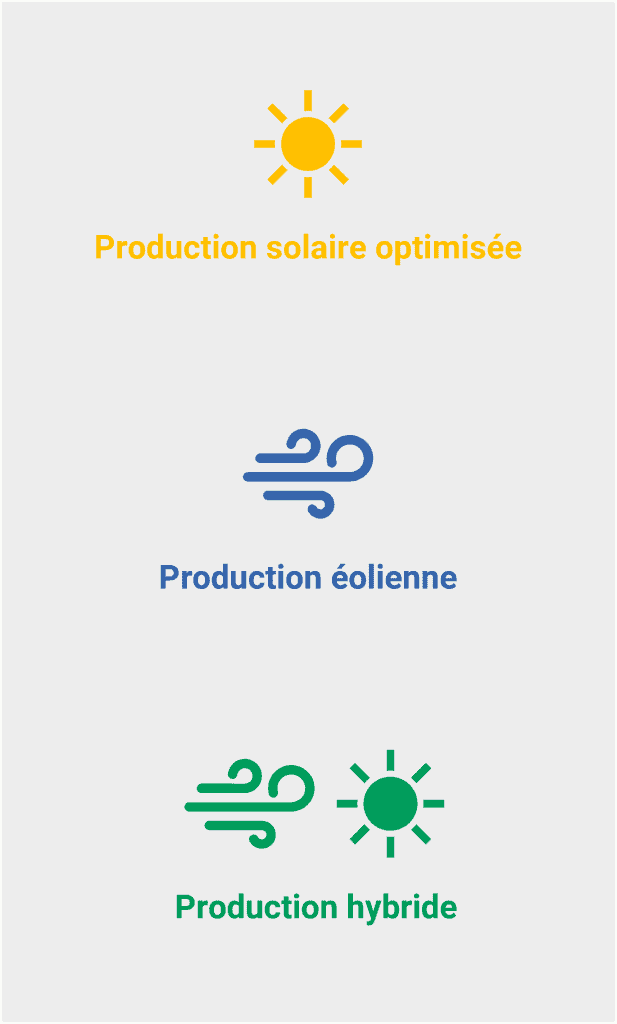
Production solaire optimisée
Installation de deux panneaux solaires photovoltaïques de 375 Wc chacun (surface équivalente à une WindBox), inclinés et orientés optimalement par rapport à la zone.
Cas test 2 :
Production éolienne
Installation d’une turbine éolienne seule de 1 500 W (surface équivalente à la surface occupée par une WindBox).
Cas test 3 :
Production hybride
Installation d’un module hybride WindBox de 2 250 W avec des panneaux orientés au maximum à 10° dans le même sens que la turbine éolienne.
Production mensuelle à Hambourg : solaire, éolien, hybride
Le solaire et l'éolien ont des courbes de production inversée
Production solaire optimisée
On considère une installation optimale sur la toiture avec des panneaux orientés sud avec une inclinaison de 40°.
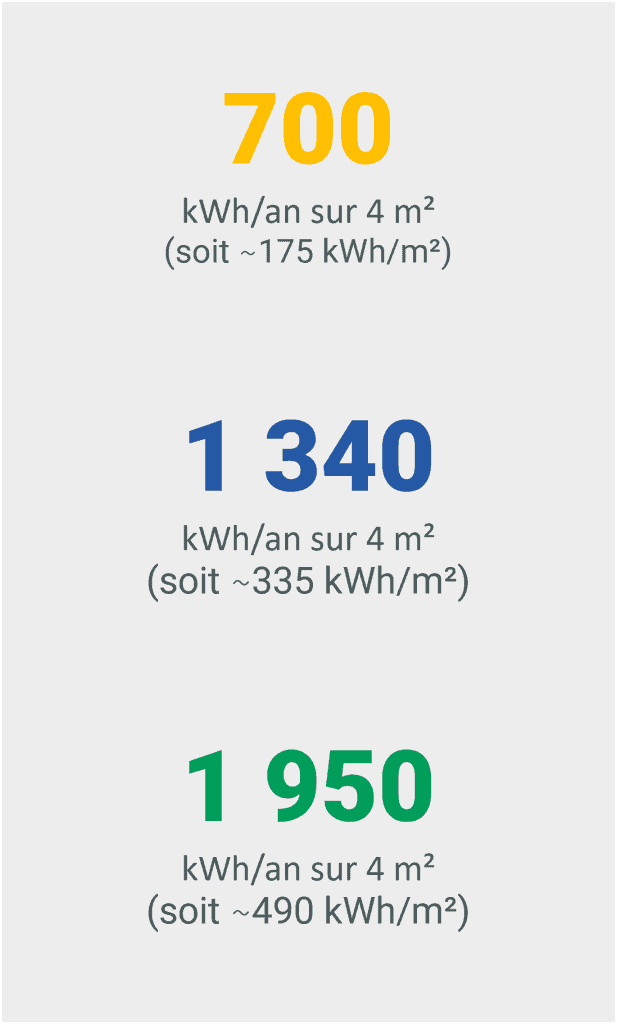
La production solaire moyenne est de 700 kWh par an et 60 kWh par mois, avec une variabilité de production de 45% par rapport à cette moyenne selon le mois considéré. Les mois les plus productifs sont les mois d’été.
Production éolienne
On considère une installation d'une turbine éolienne sur une façade orientée ouest d'un bâtiment de 20 m de haut.
La production issue de la turbine éolienne est de 1 340 kWh par an et 110 kWh par mois en moyenne, avec un écart-moyen de 23%. Les mois les plus productifs sont les mois d’hiver.
Production hybride
Dans ce cas, les panneaux solaires photovoltaïques sont posés à 5°, ce qui induit une baisse de la production (610 kWh à l’année contre 700 kWh avec une inclinaison optimale).
La production hybride est équilibrée entre les saisons
Production solaire optimisée (%)
Production éolienne (%)
Production hybride (%)
Production mensuelle à Marseille : solaire, éolien, hybride
En couplant solaire et éolien, la production totale connaît un pic en été
Production solaire optimisée
On considère une installation optimale sur la toiture avec des panneaux orientés sud avec une inclinaison de 40°.
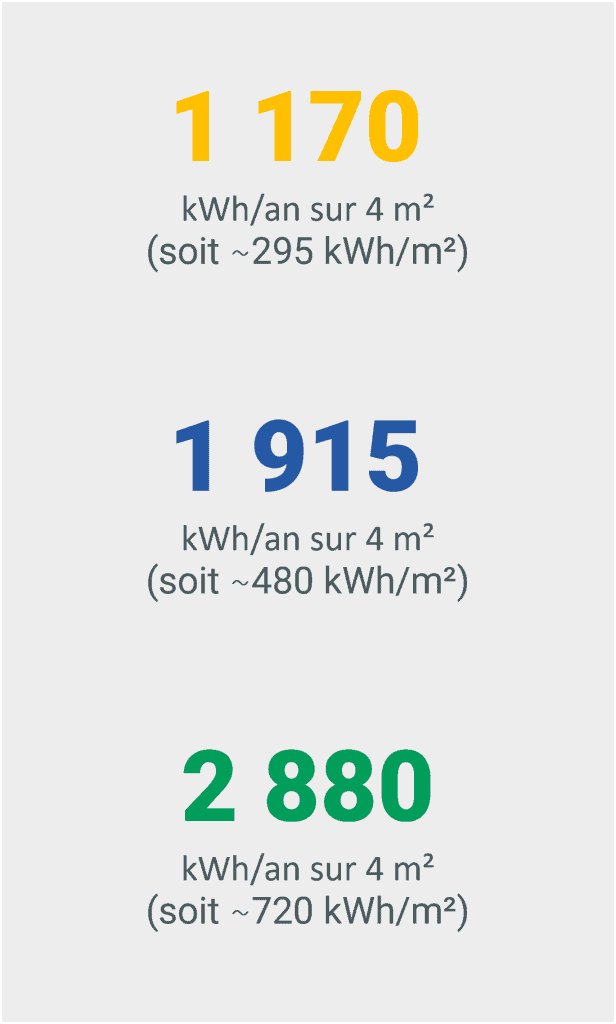
La production solaire moyenne est de 1 170 kWh par an et 100 kWh par mois, avec une variabilité de production de 28% par rapport à cette moyenne selon le mois considéré. Les mois les plus productifs sont les mois d’été.
Production éolienne
On considère une installation d'une turbine éolienne sur une façade orientée ouest d'un bâtiment de 20 m de haut.
A Marseille, la production issue de la turbine éolienne est de 1 915 kWh à l’année en moyenne, avec un écart-moyen de 13%. Cette faible variation saisonnière est propre au bassin méditerranéen et s’explique par des vents forts orientés nord toute l’année
Production hybride
Dans ce cas également, les panneaux solaires photovoltaïques sont posés à 5°, ce qui induit une baisse de la production (965 kWh à l’année contre 1 170 kWh avec une inclinaison optimale).
Au global, une production hybride équilibrée entre les saisons
Production solaire optimisée (%)
Production éolienne (%)
Production hybride (%)
Assurer une production d'énergie de jour comme de nuit
Quelle que soit la typologie de bâtiments, ceux-ci consomment de l’électricité de jour comme de nuit :
- fonctionnement en trois-huit des bâtiments industriels ou logistiques ;
- besoin de garder la chaine du froid pour le tertiaire ;
- ou encore alimenter ascenseurs et VMC sur des logements.
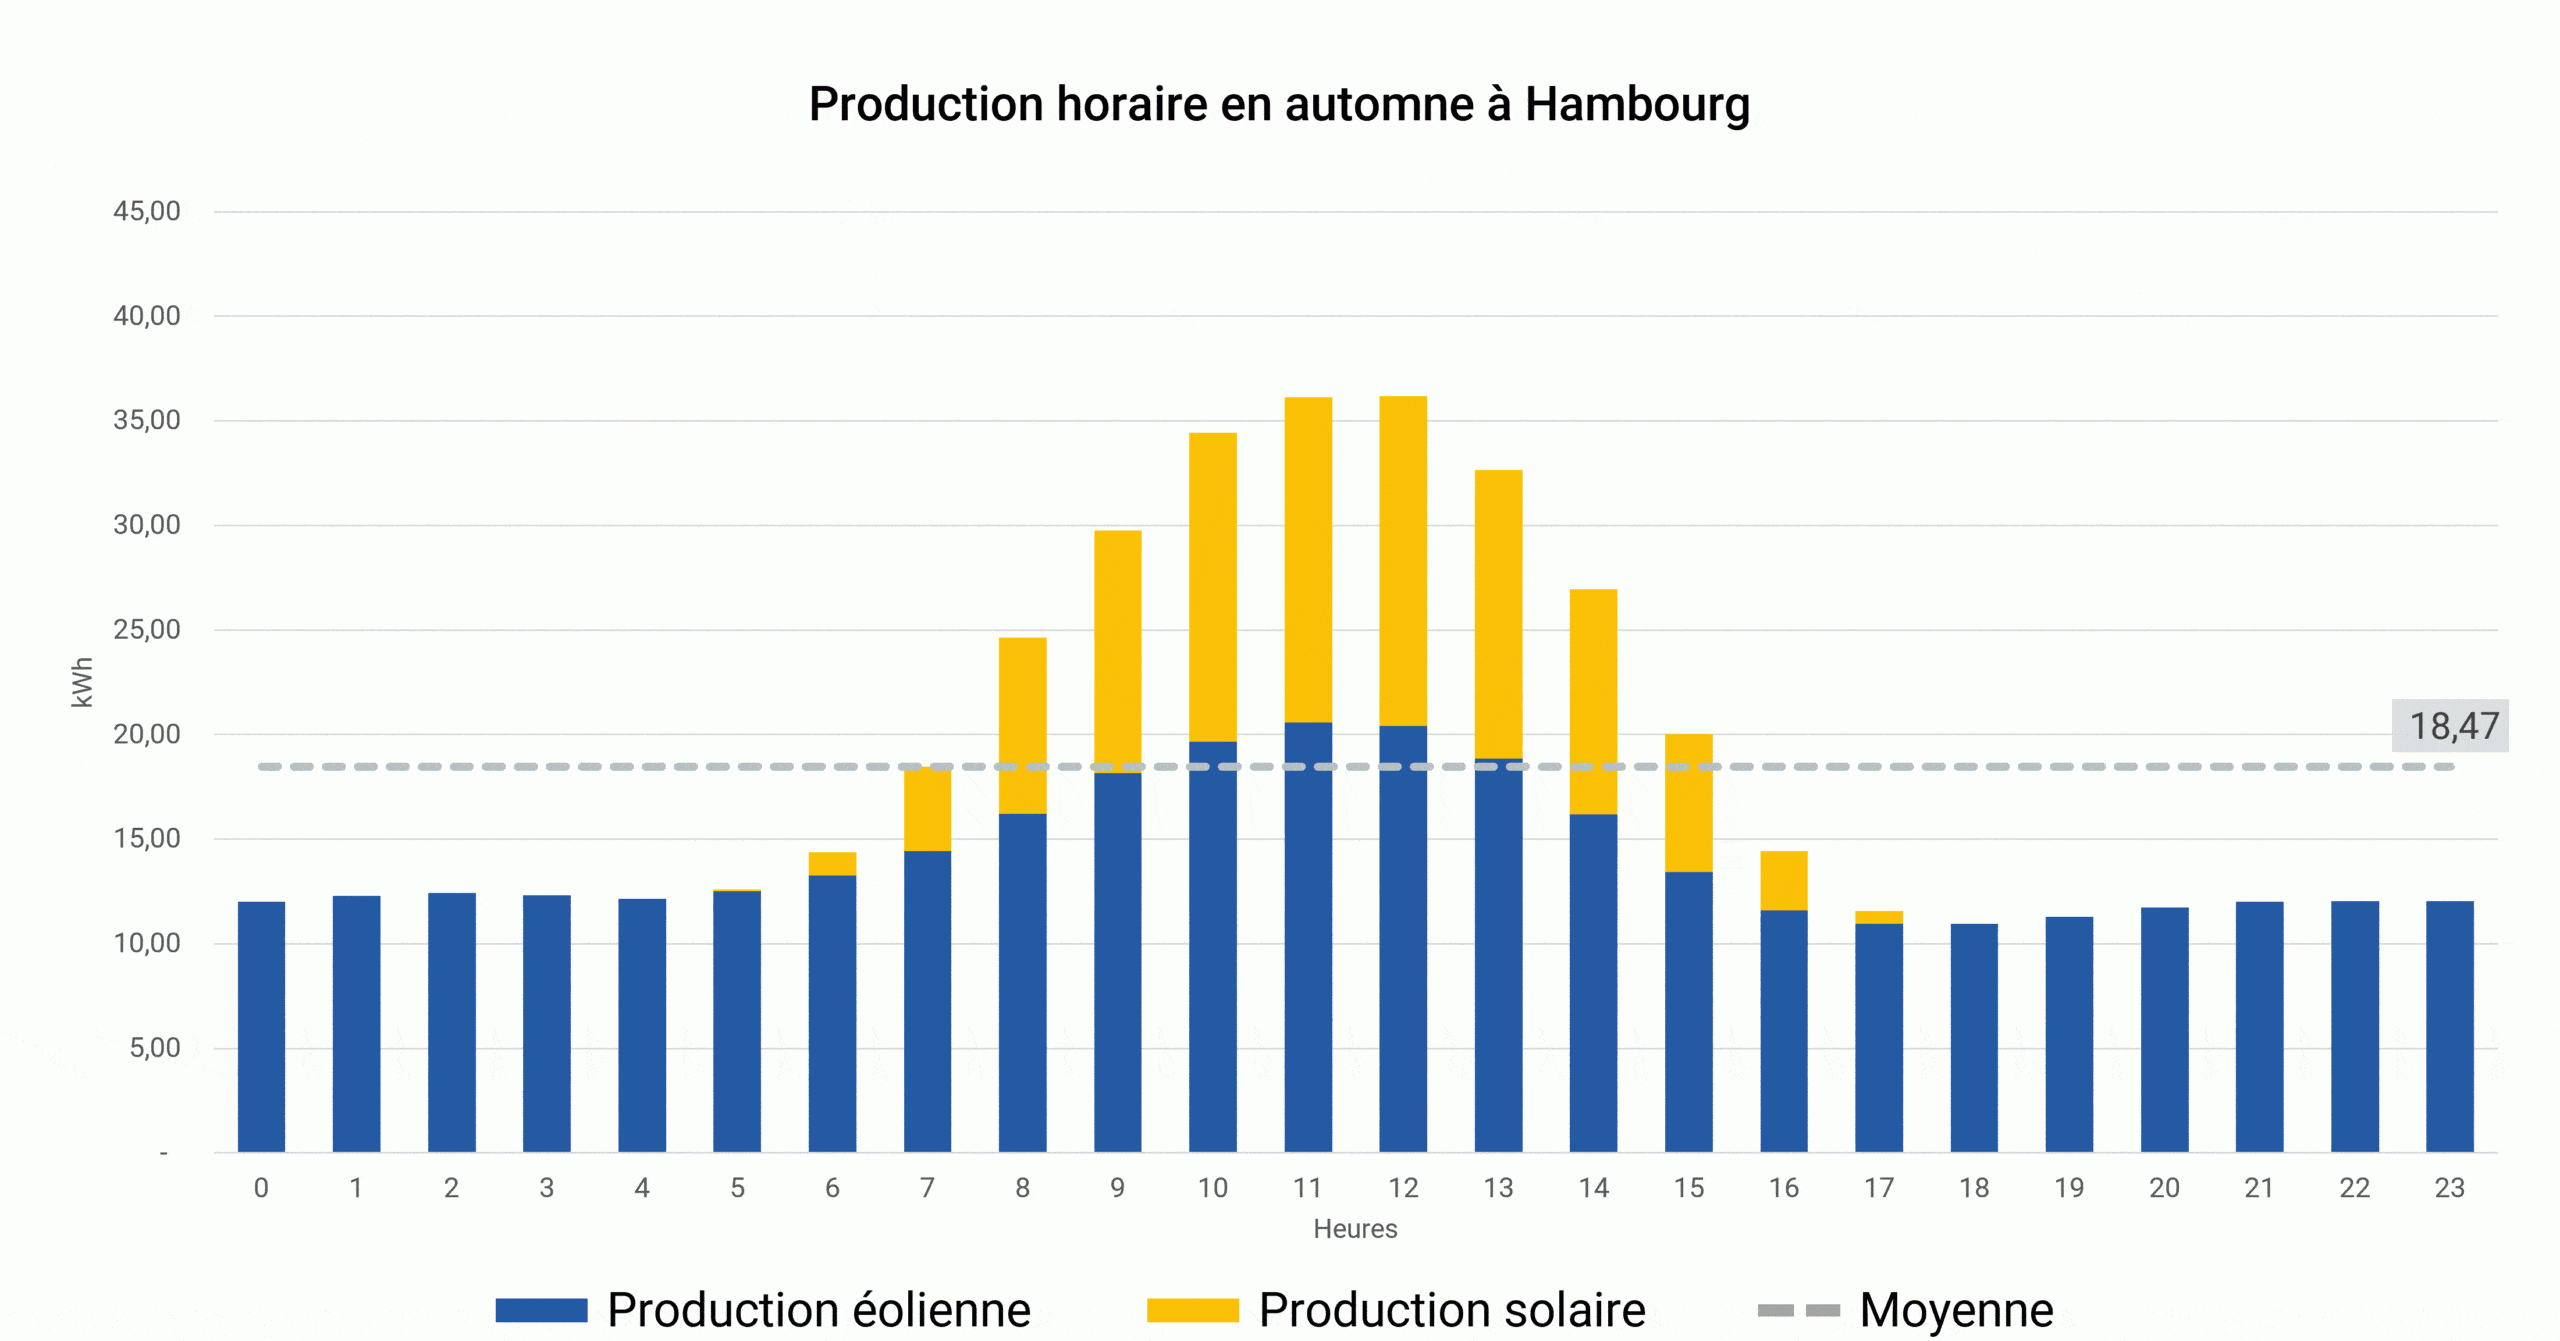
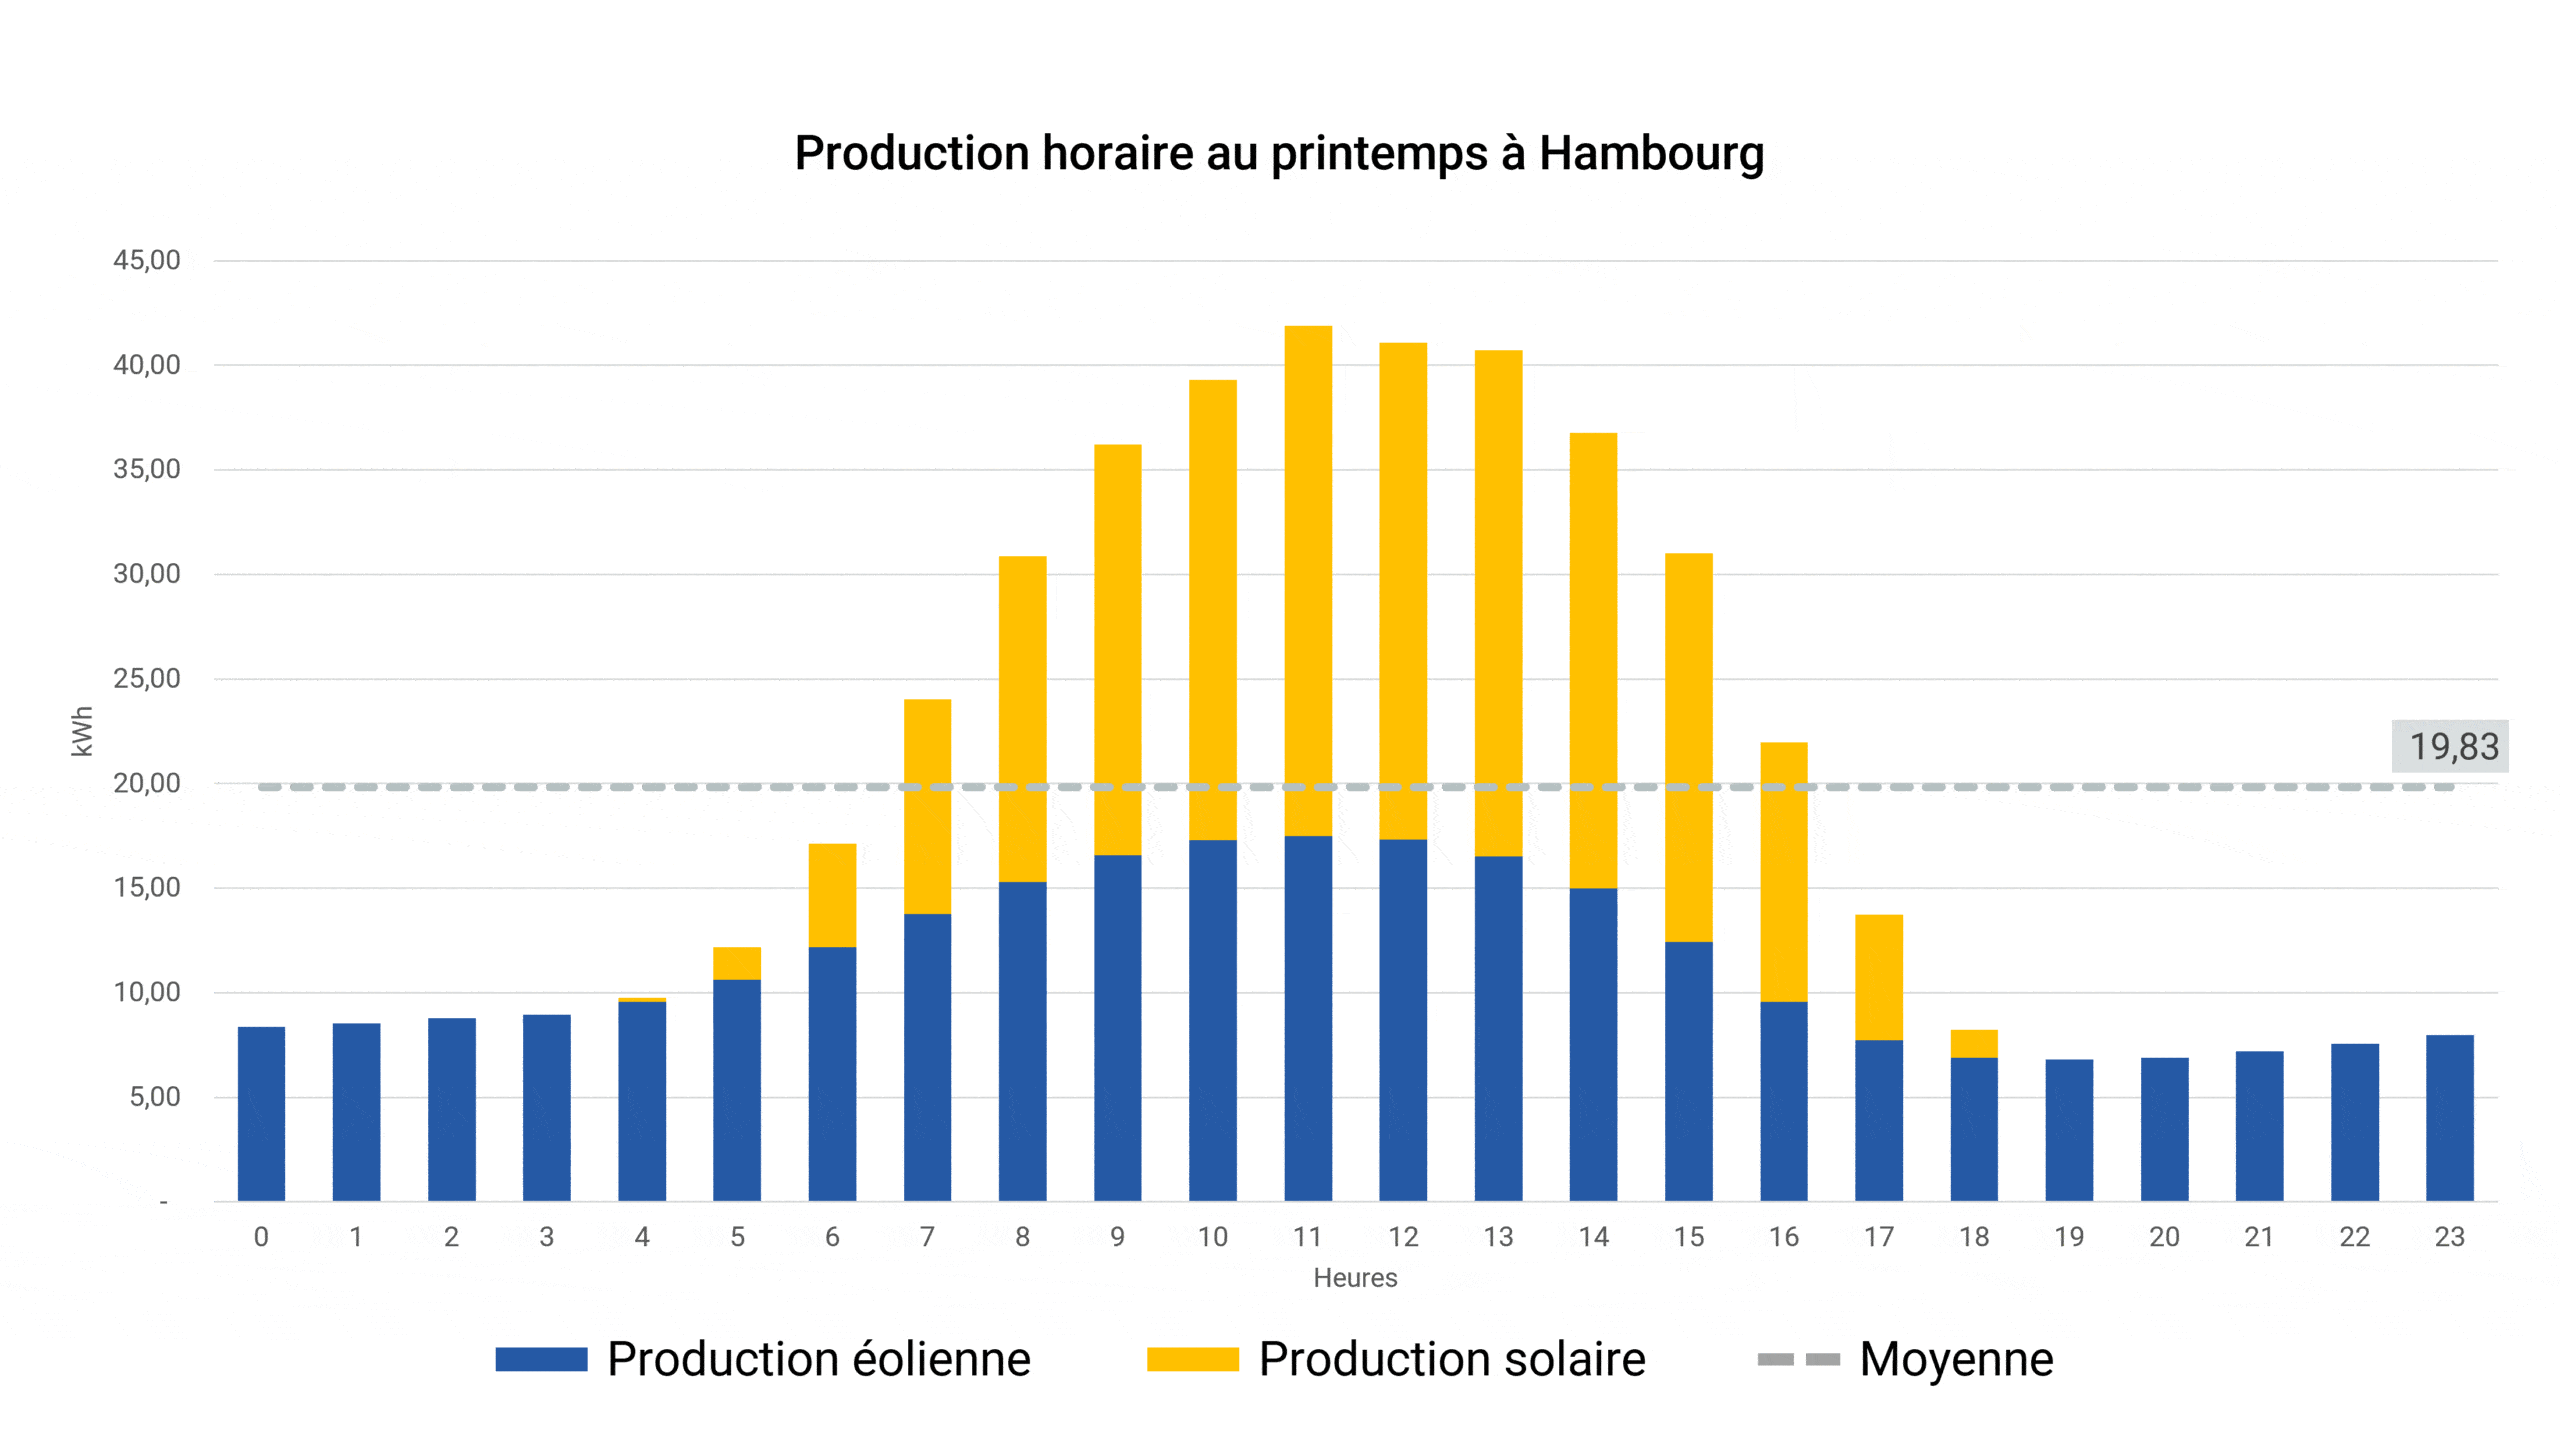
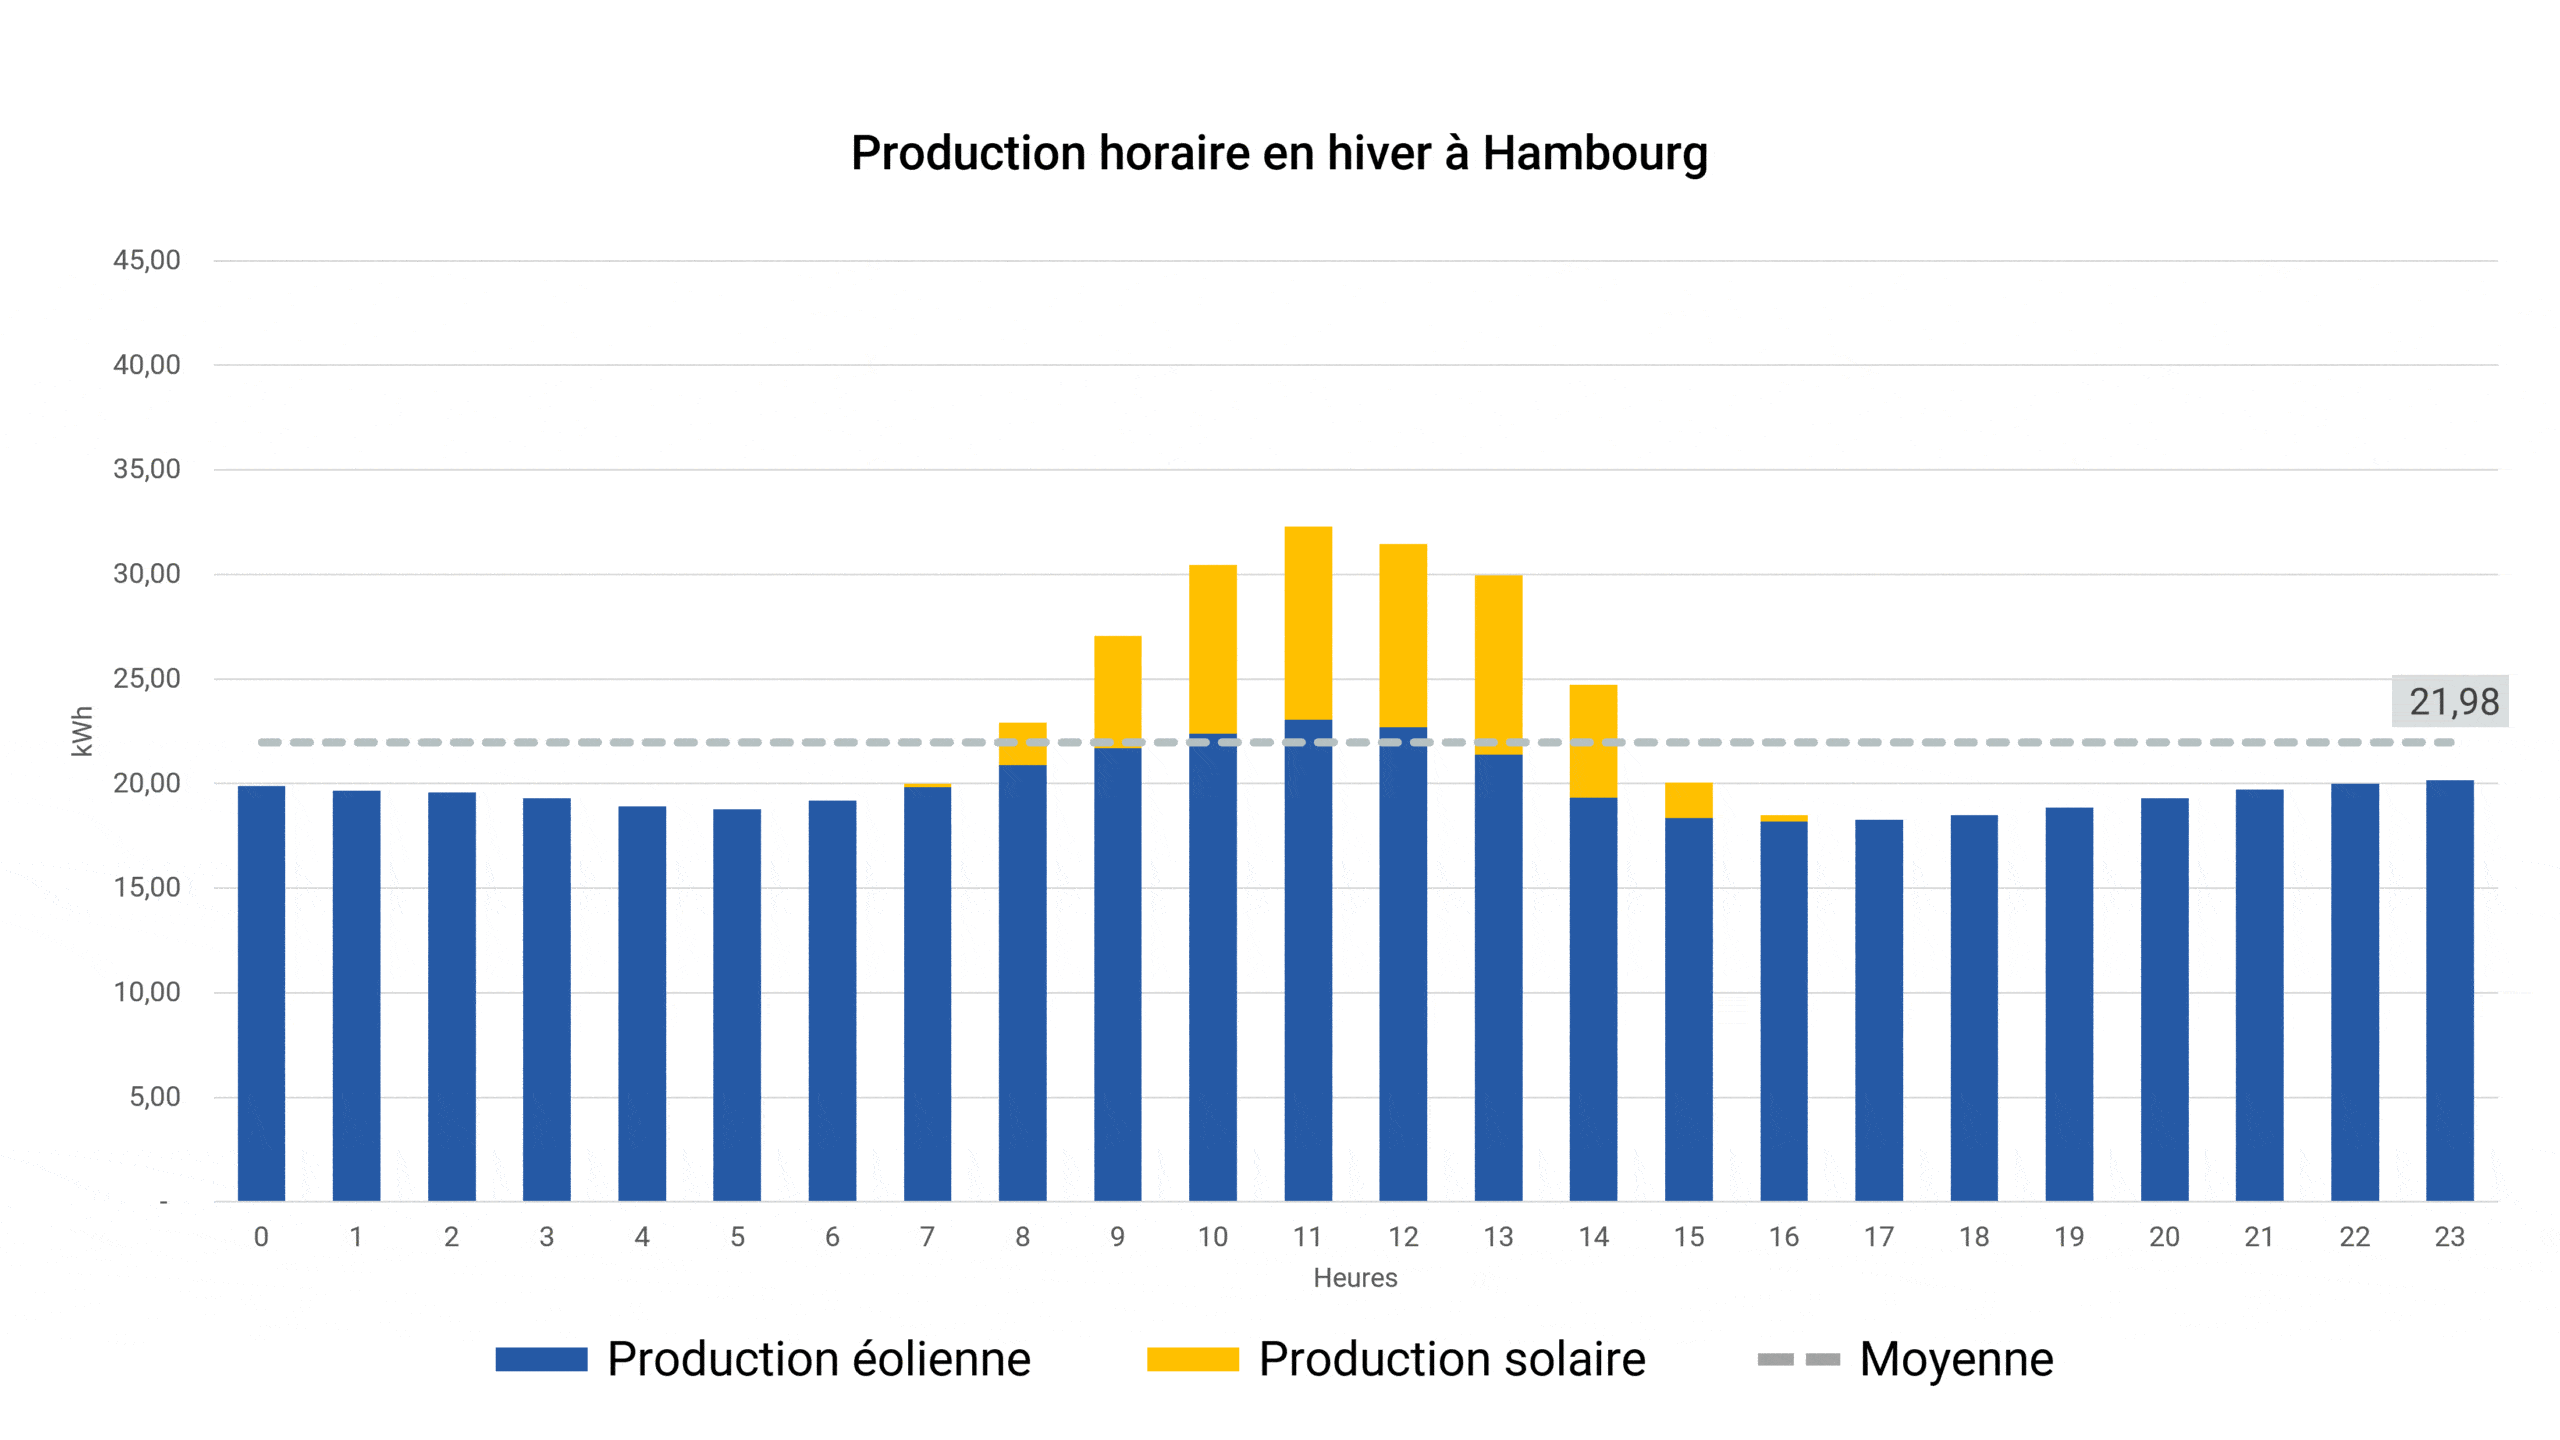
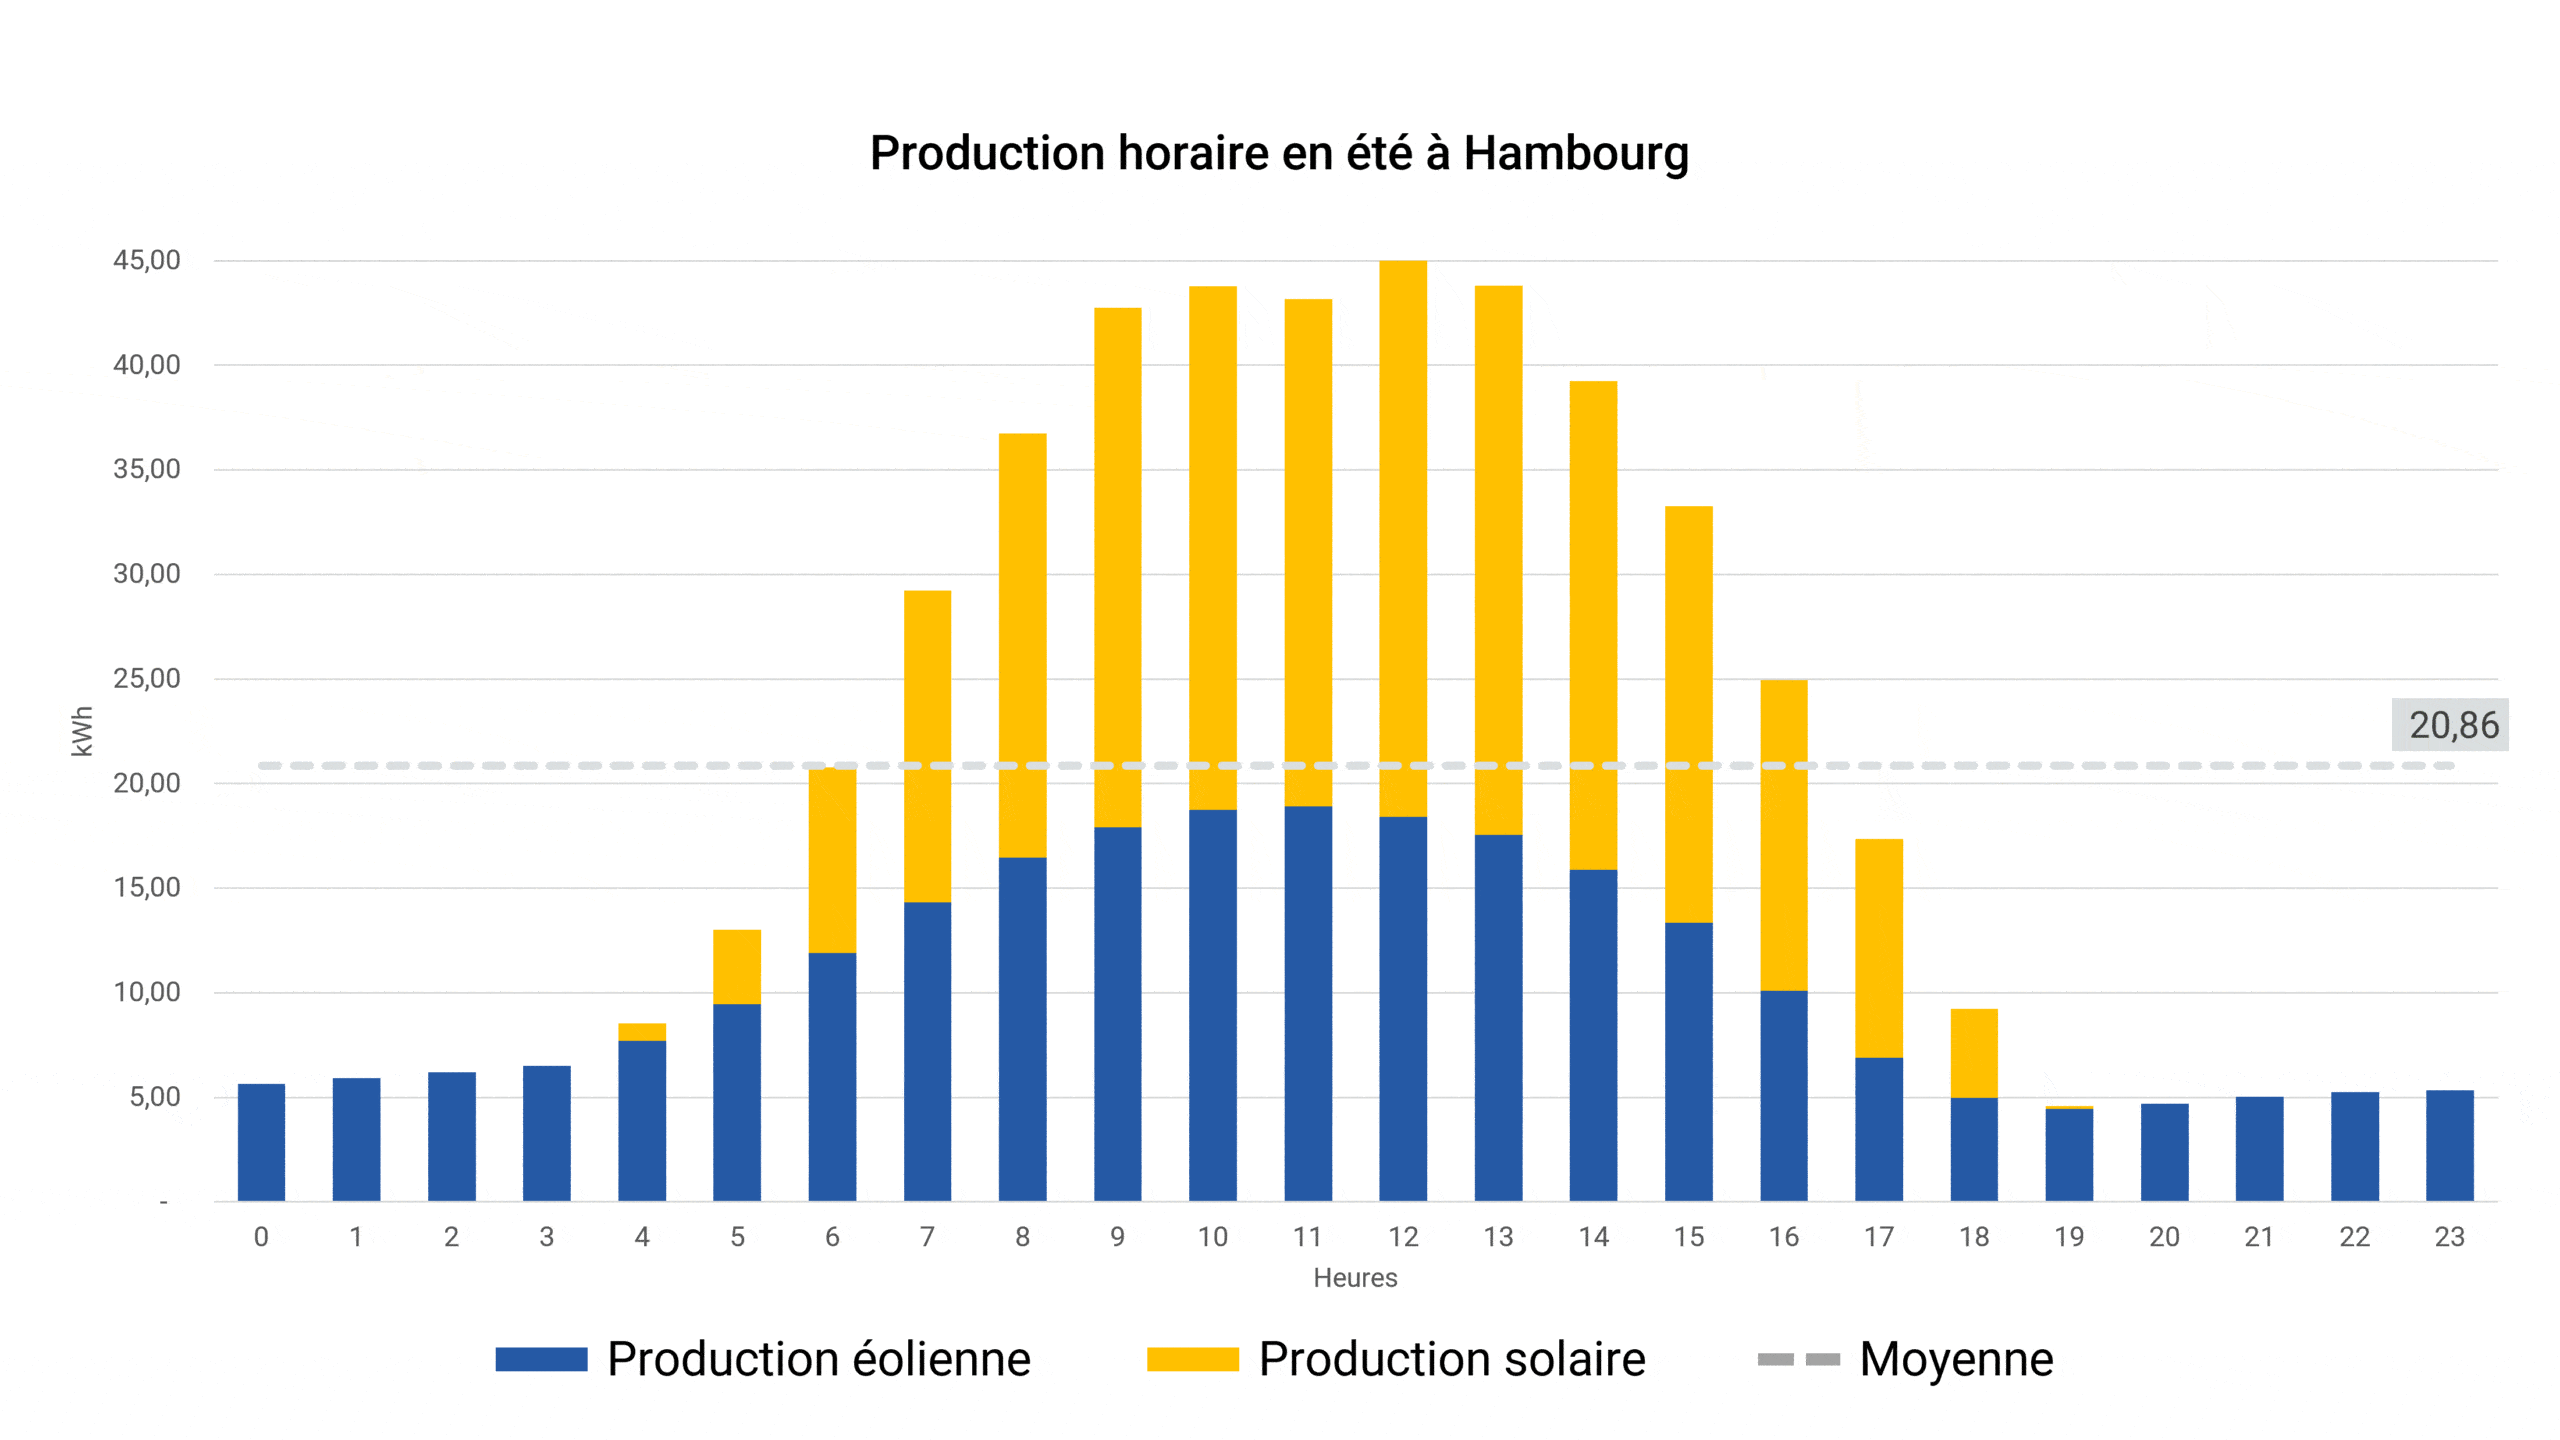
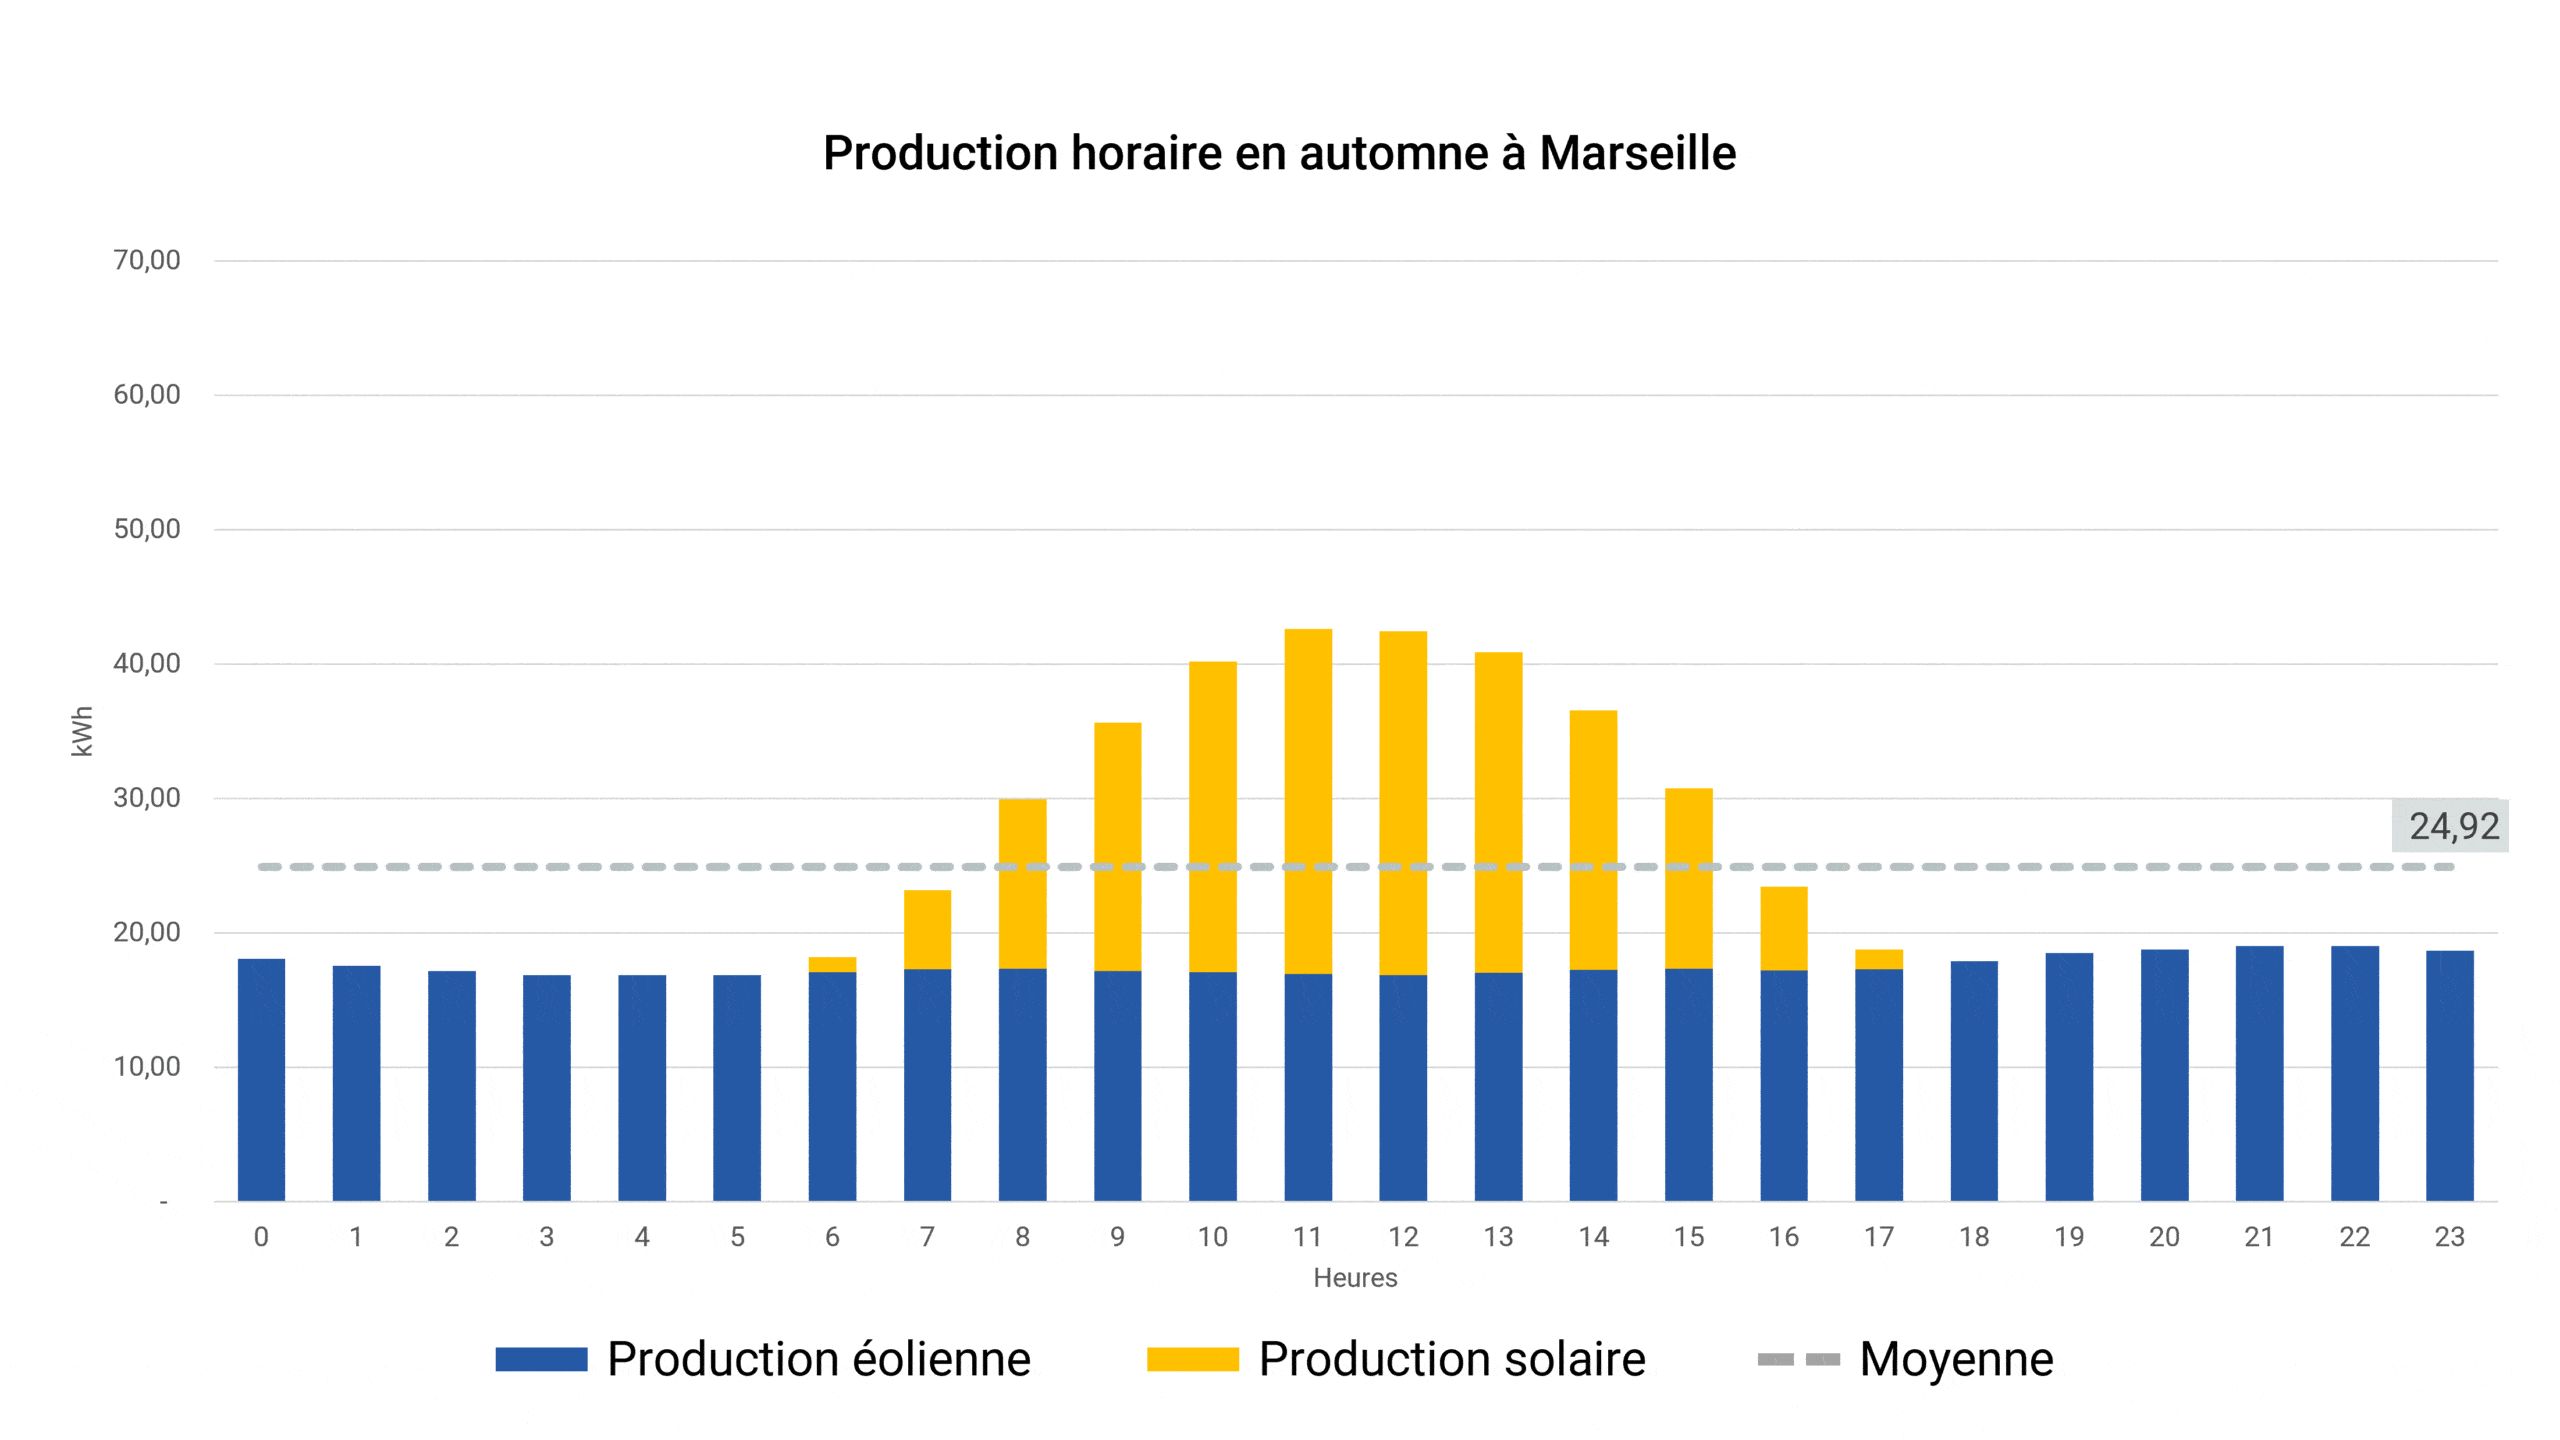
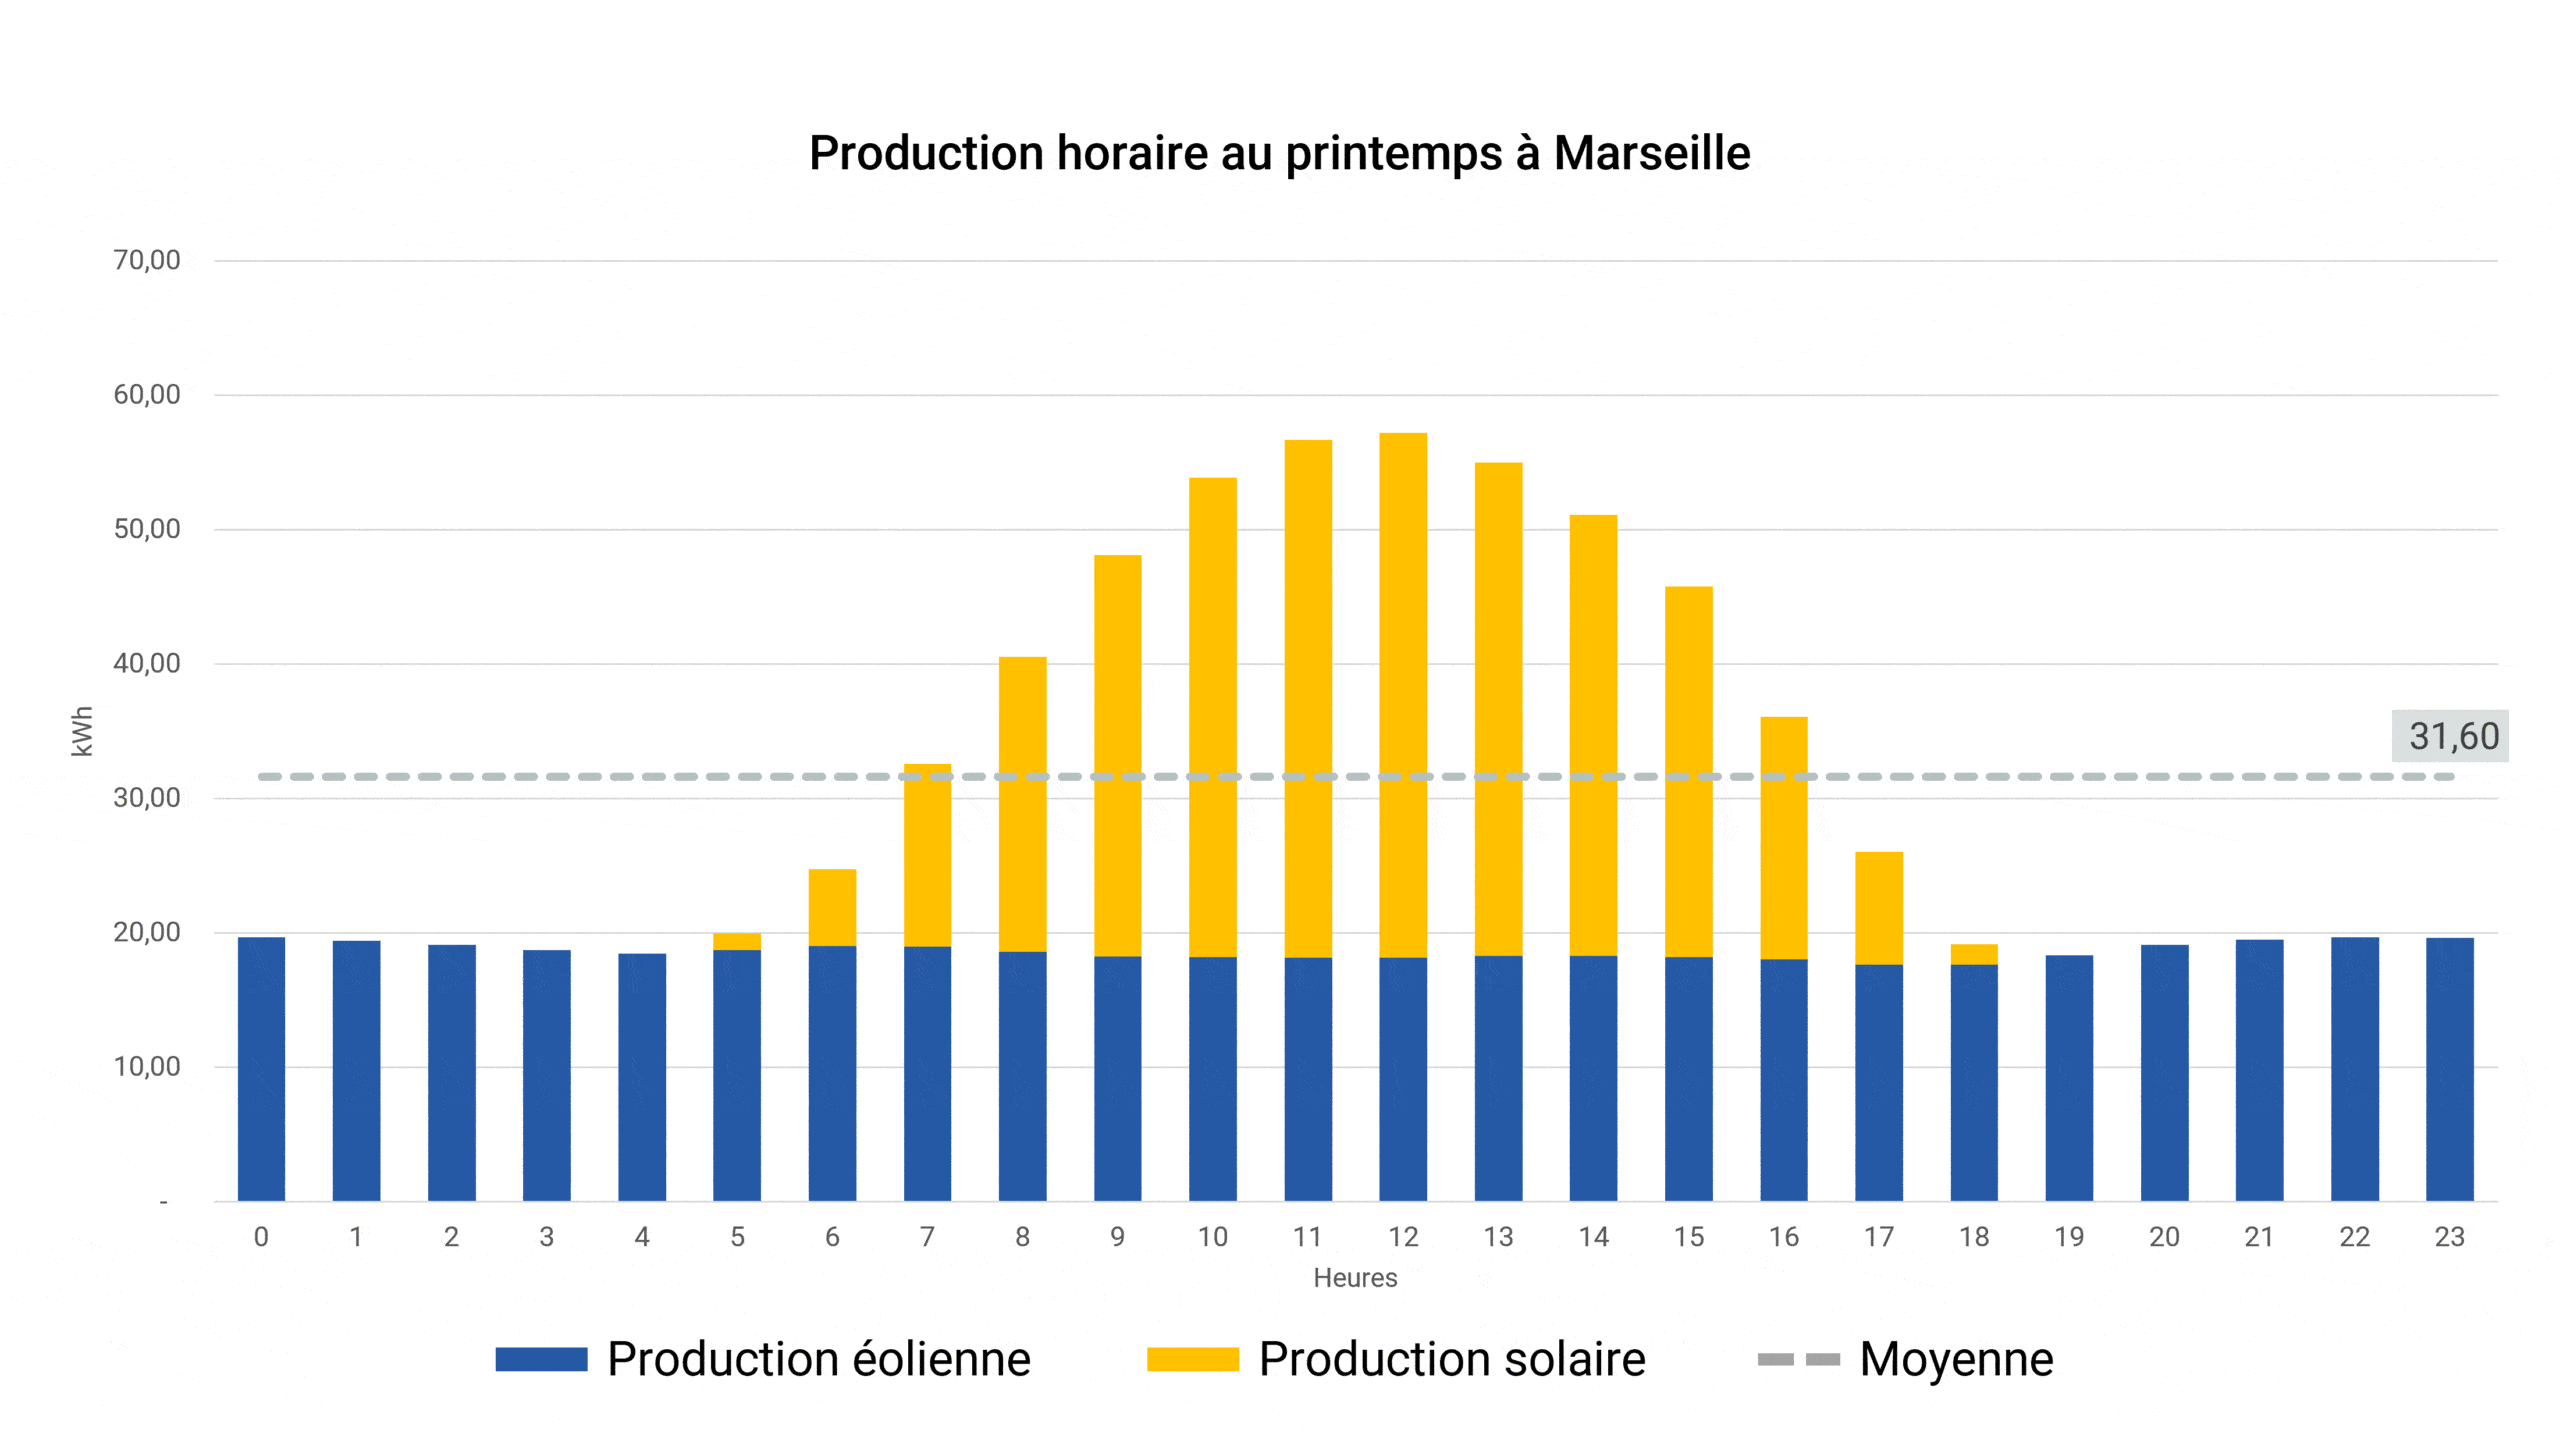
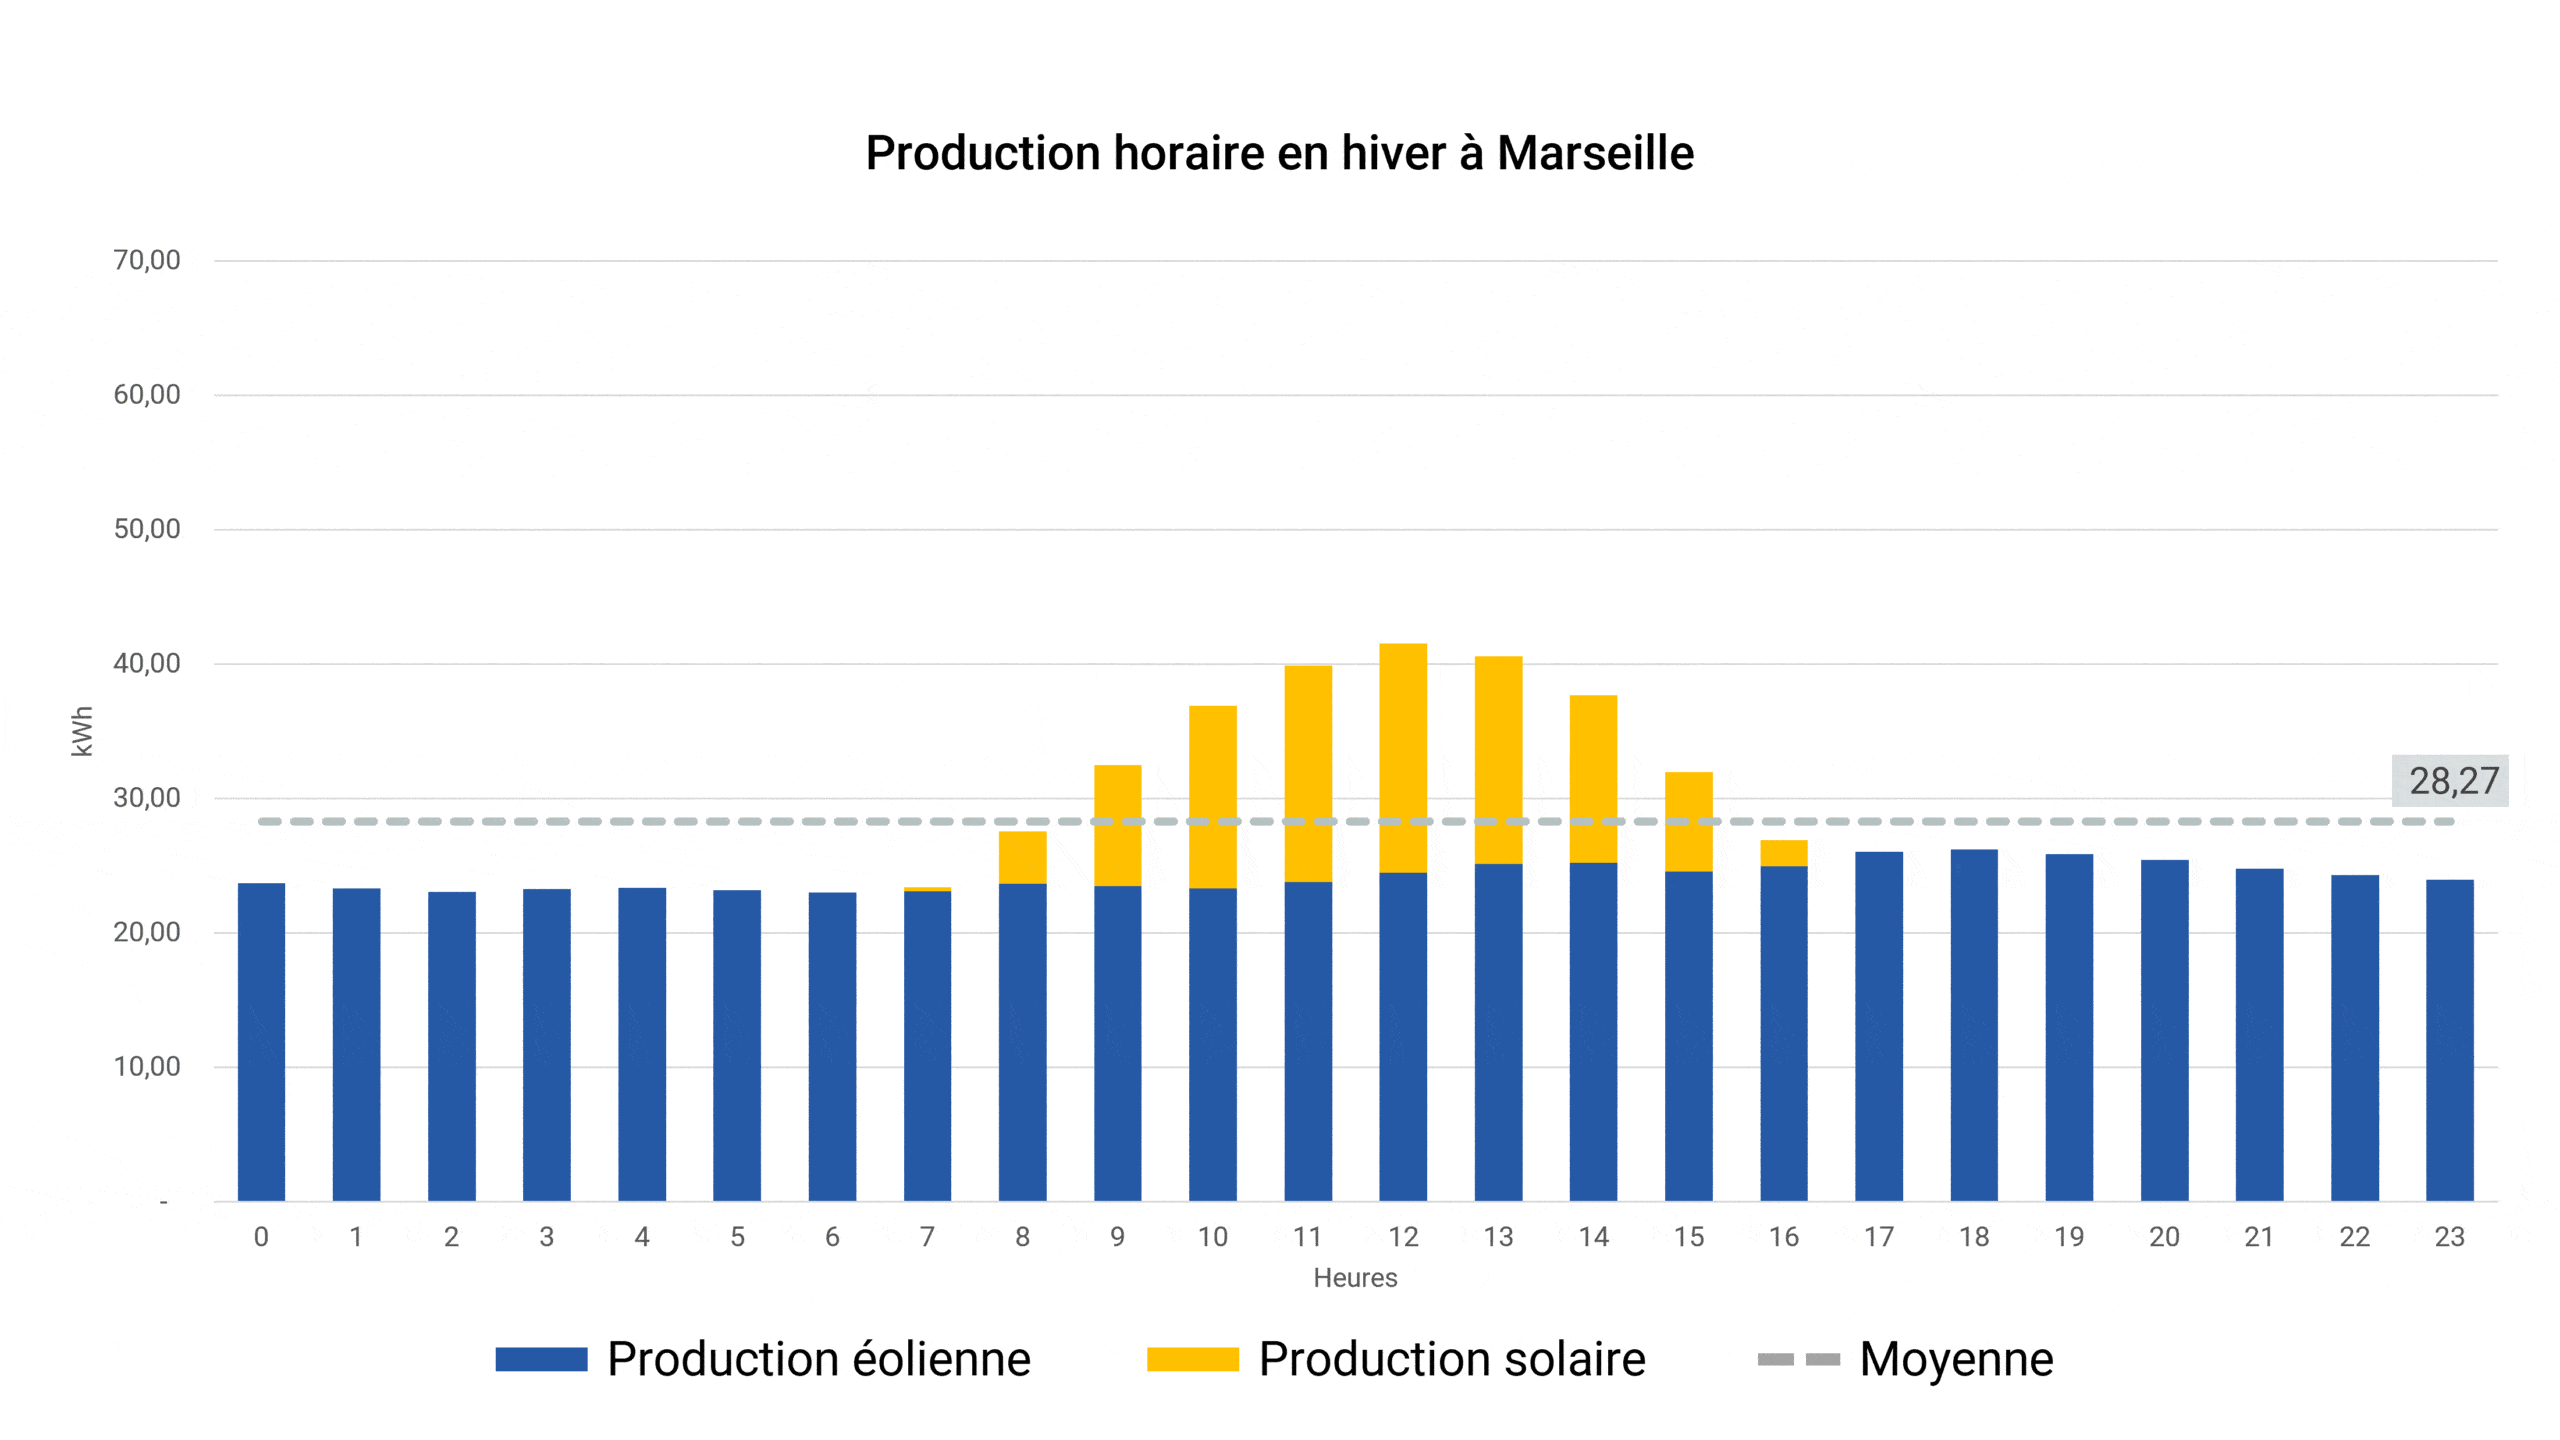
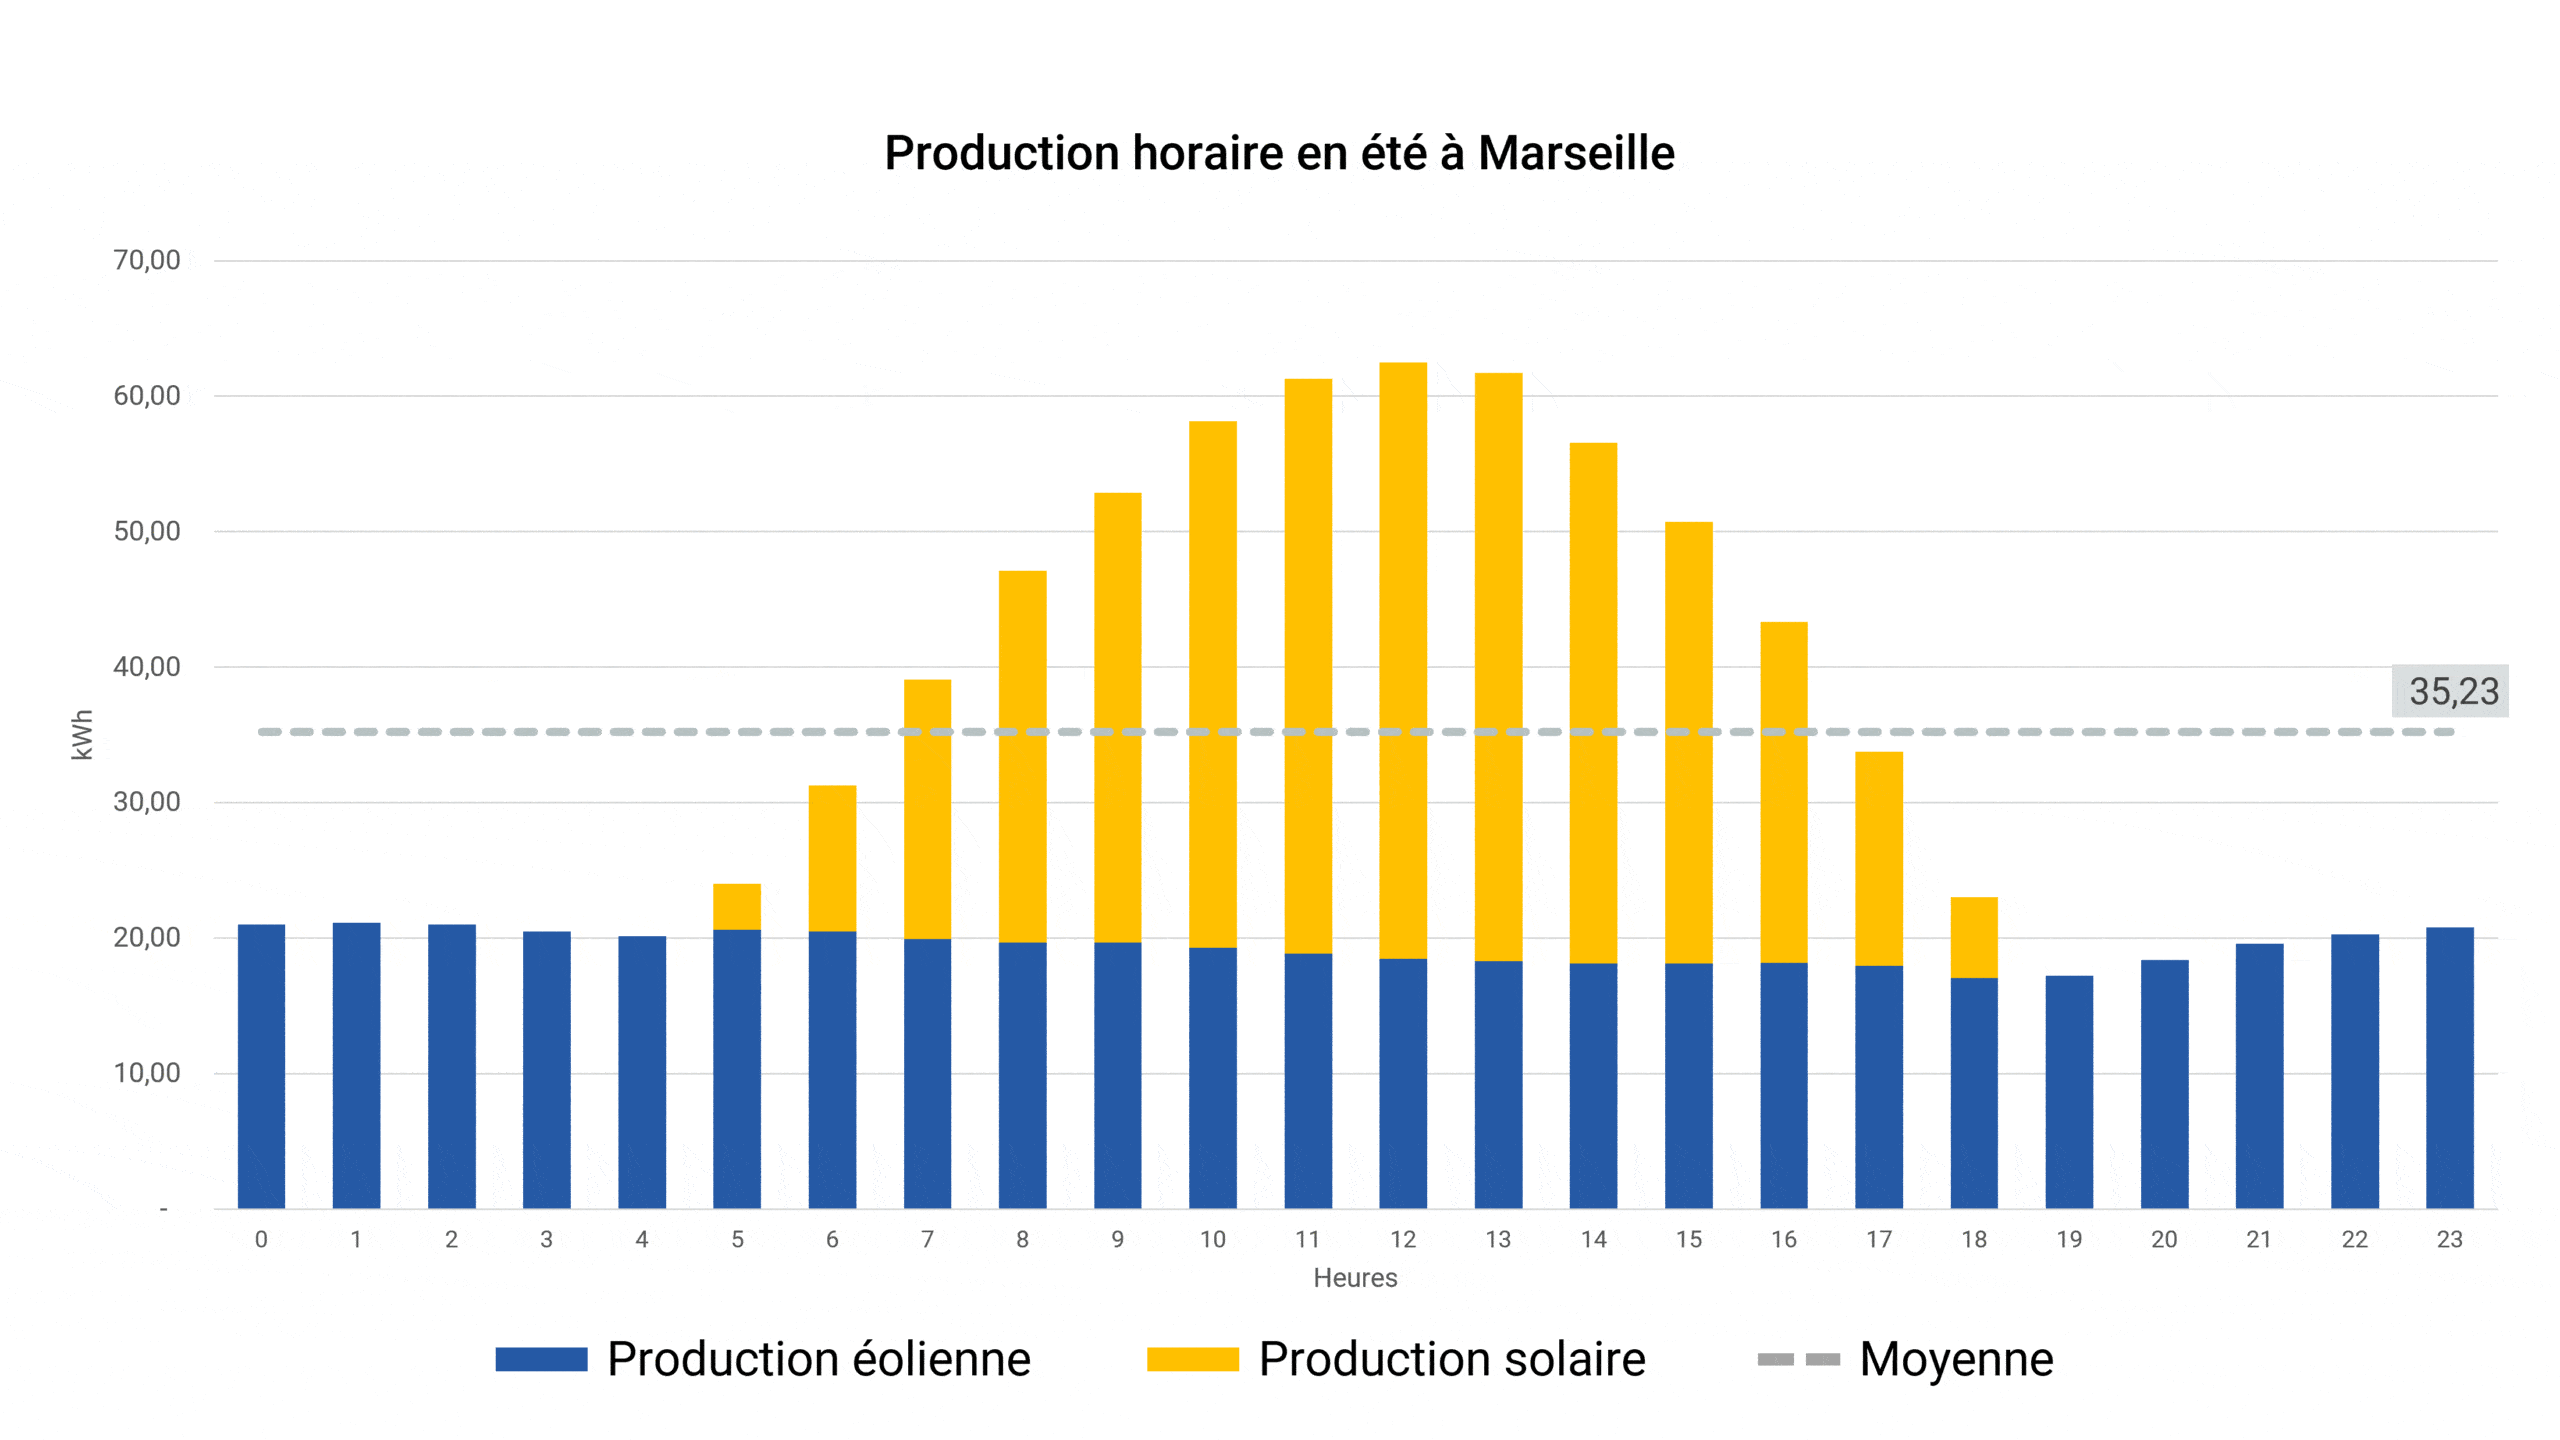
La production solaire se concentre exclusivement en journée, avec un pic autour de midi. La production éolienne est mieux répartie dans la journée, avec un léger pic en fin de matinée/ début d’après-midi. Pour assurer une production constante, il est donc vital de diversifier les sources d’énergie renouvelable en toiture.
Reprenons les exemples précédents et détaillons le profil horaire des productions solaire, éolienne et hybride en fonction des quatre saisons.
Production horaire à Hambourg : solaire, éolien, hybride
Production horaire à Marseille : solaire, éolien, hybride
La production solaire a le même profil horaire qu’à Hambourg, avec un fonctionnement de 10 à 14 heures selon les saisons et un pic aux alentours de midi. La production éolienne est continue et stable (écart-moyen entre 0,5 et 1,1 points selon les saisons). La production hybride garantit ici aussi un talon de production minimal.
Augmenter la production sur des espaces contraints
Le dernier argument en faveur des solutions hybrides est la question d’espace disponible en toiture. En effet, les toitures présentent de multiples désavantages pour les installations d’énergies renouvelables :
- La structure des bâtiments n’a pas été pensée pour accueillir des équipements techniques.
- Lorsque la structure le permet, l’espace disponible est réduit car d’autres équipements techniques y sont souvent installés.
L’espace disponible étant contraint, il faut d’une part favoriser les technologies les plus productives, qui permettent de maximiser la production. D’autre part, pour prévenir les problèmes structurels, une solution est de préférer les technologies qui s’installent en bordure de bâtiment : la toiture y est plus résistante. L’espace n’y étant pas infini, il convient d’y placer les solutions les plus performantes.
C’est le cas des solutions hybrides. En termes de puissance, une WindBox de 4m² représente l’équivalent 12 m² de panneaux solaires. En termes de production, les résultats dépendent des conditions météorologiques du bâtiment étudié.
Reprenons les exemples développés précédemment.
Hambourg
Marseille
